Balance Sheet
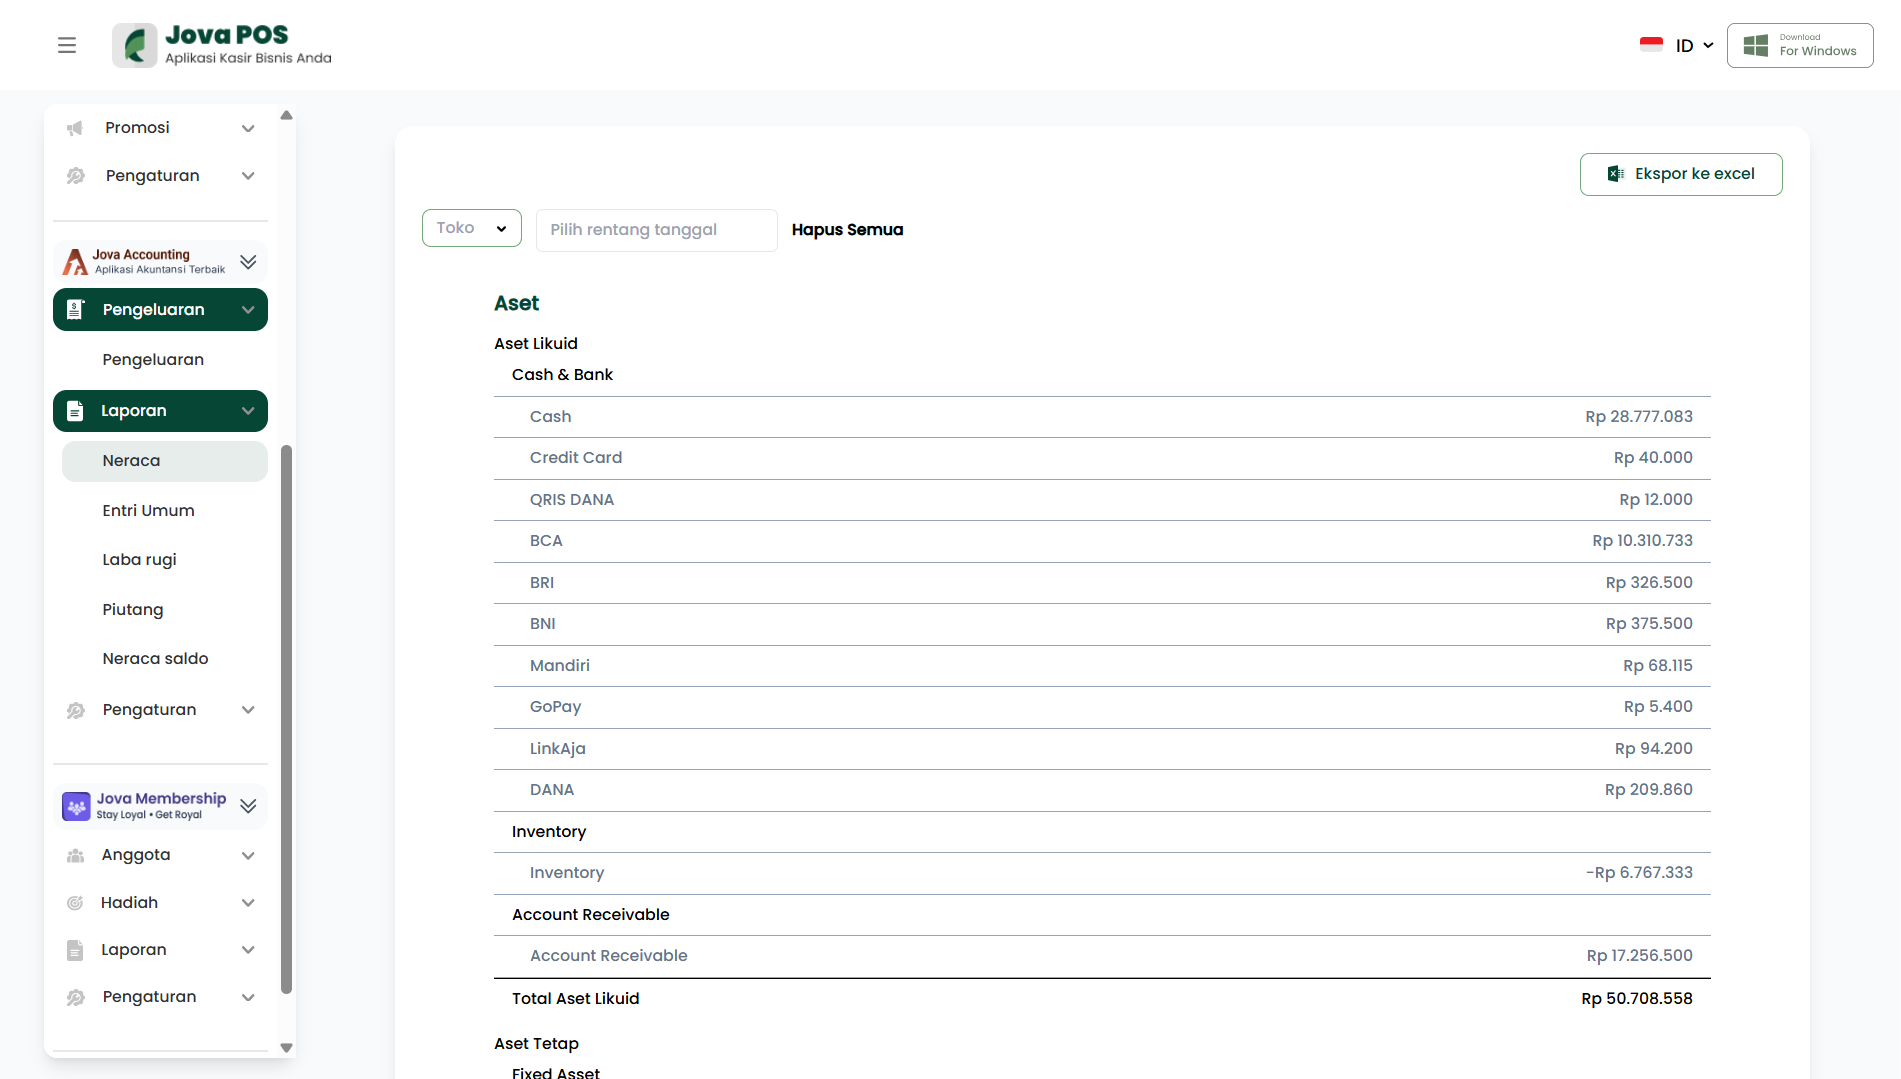
The Balance Sheet menu displays the store's financial position for a specific period. This report summarizes Assets, Liabilities, and Equity so you can check the balance of total assets against total liabilities and equity.
1. Opening the Balance Sheet report
To open the balance sheet report, follow these steps:
- Open the Reports menu in the sidebar on the left side of the page.
- Select and click Balance Sheet.
After the page opens, the system will display the balance sheet report based on the selected store and period. You can view the overall financial position with account details separated into their respective categories.
2. Setting report filters
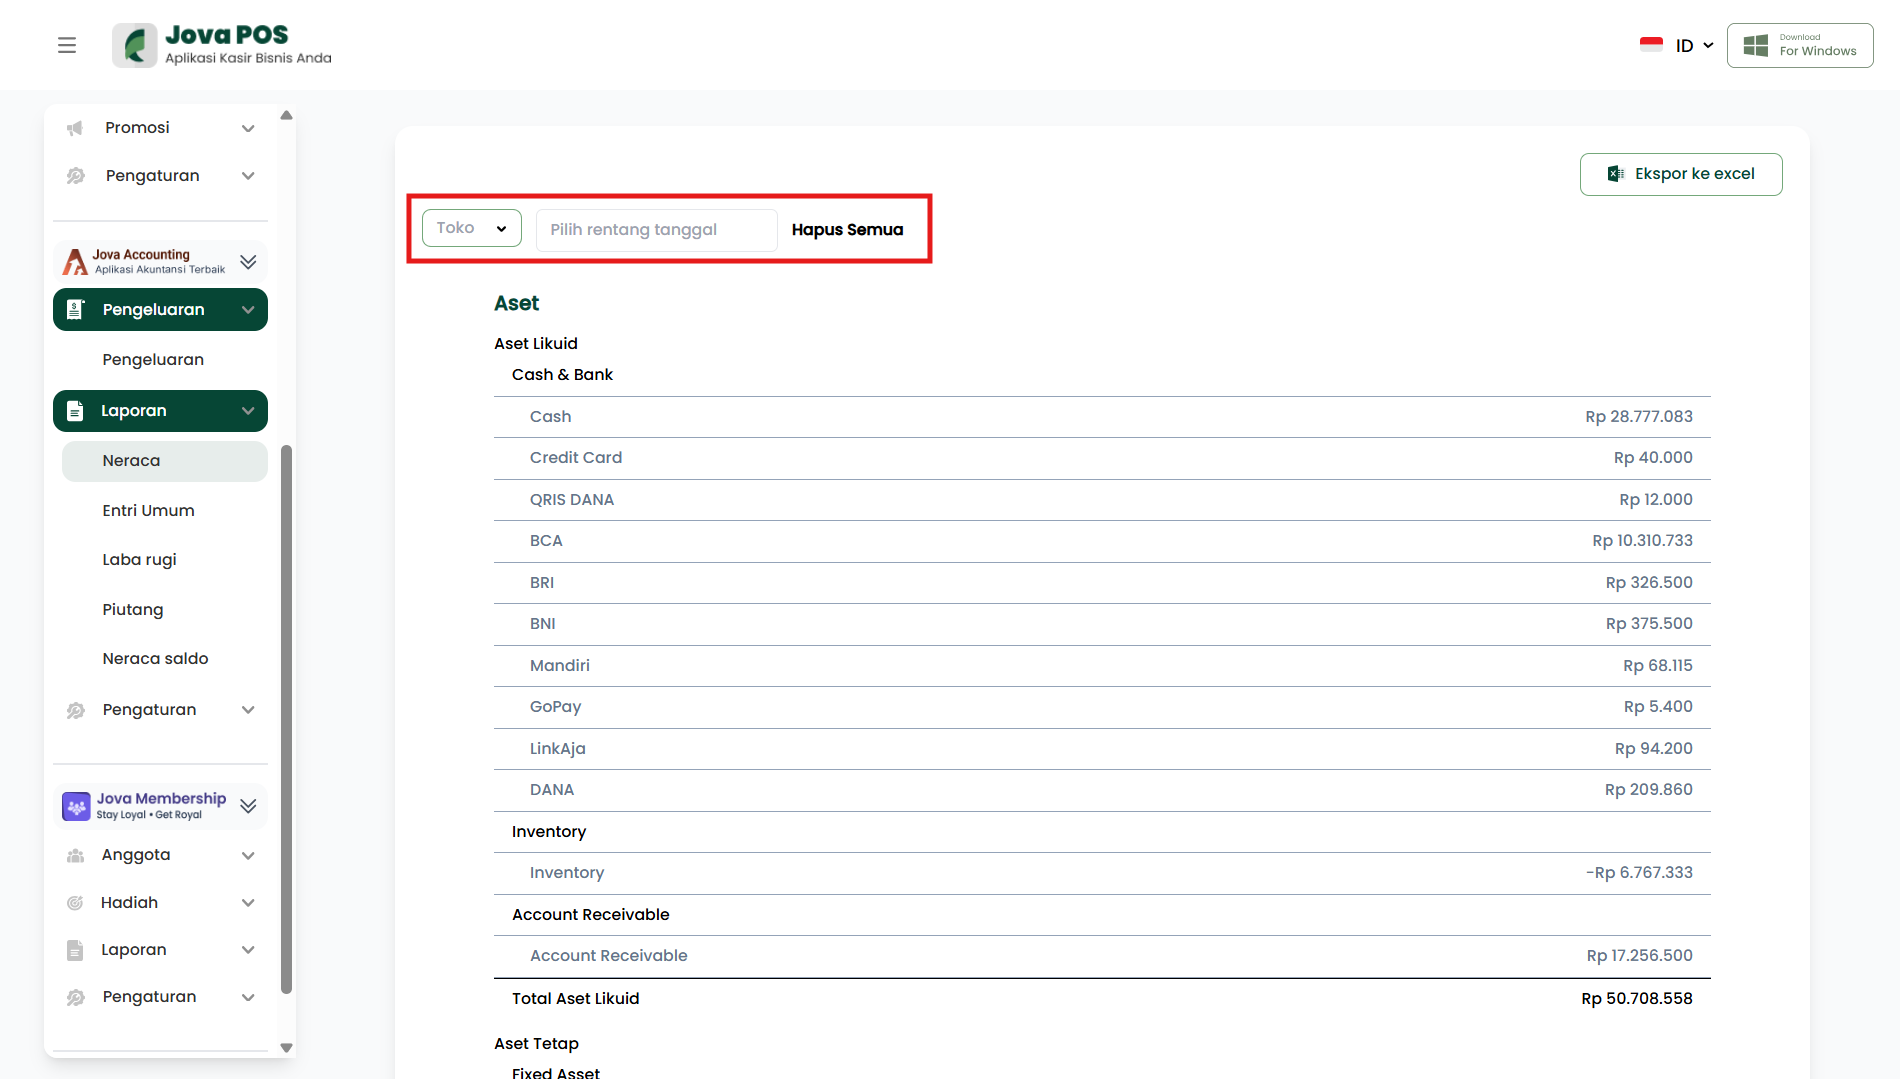
The filter section is located at the top of the page and provides flexibility in adjusting the report display as needed. These filters allow you to refine the report based on several relevant parameters.
Available filters:
-
Store
Select the store or outlet for which you want to view the balance sheet. This is useful if you want to view the report for a specific store only. -
Select date range
Specify the report period to display, e.g., to view the financial position for 1 month or based on specific dates. -
Clear All
This button will reset the filters to their default state, so the report will display all data without filters.
Tips:
- If the report figures seem incorrect or the displayed data is incomplete, double-check the selected store and date range.
- Use the same date range if you want to compare reports between multiple stores.
3. Understanding Balance Sheet report sections
The Balance Sheet is divided into two main sections: Assets and Liabilities and Equity.
3.1 Assets
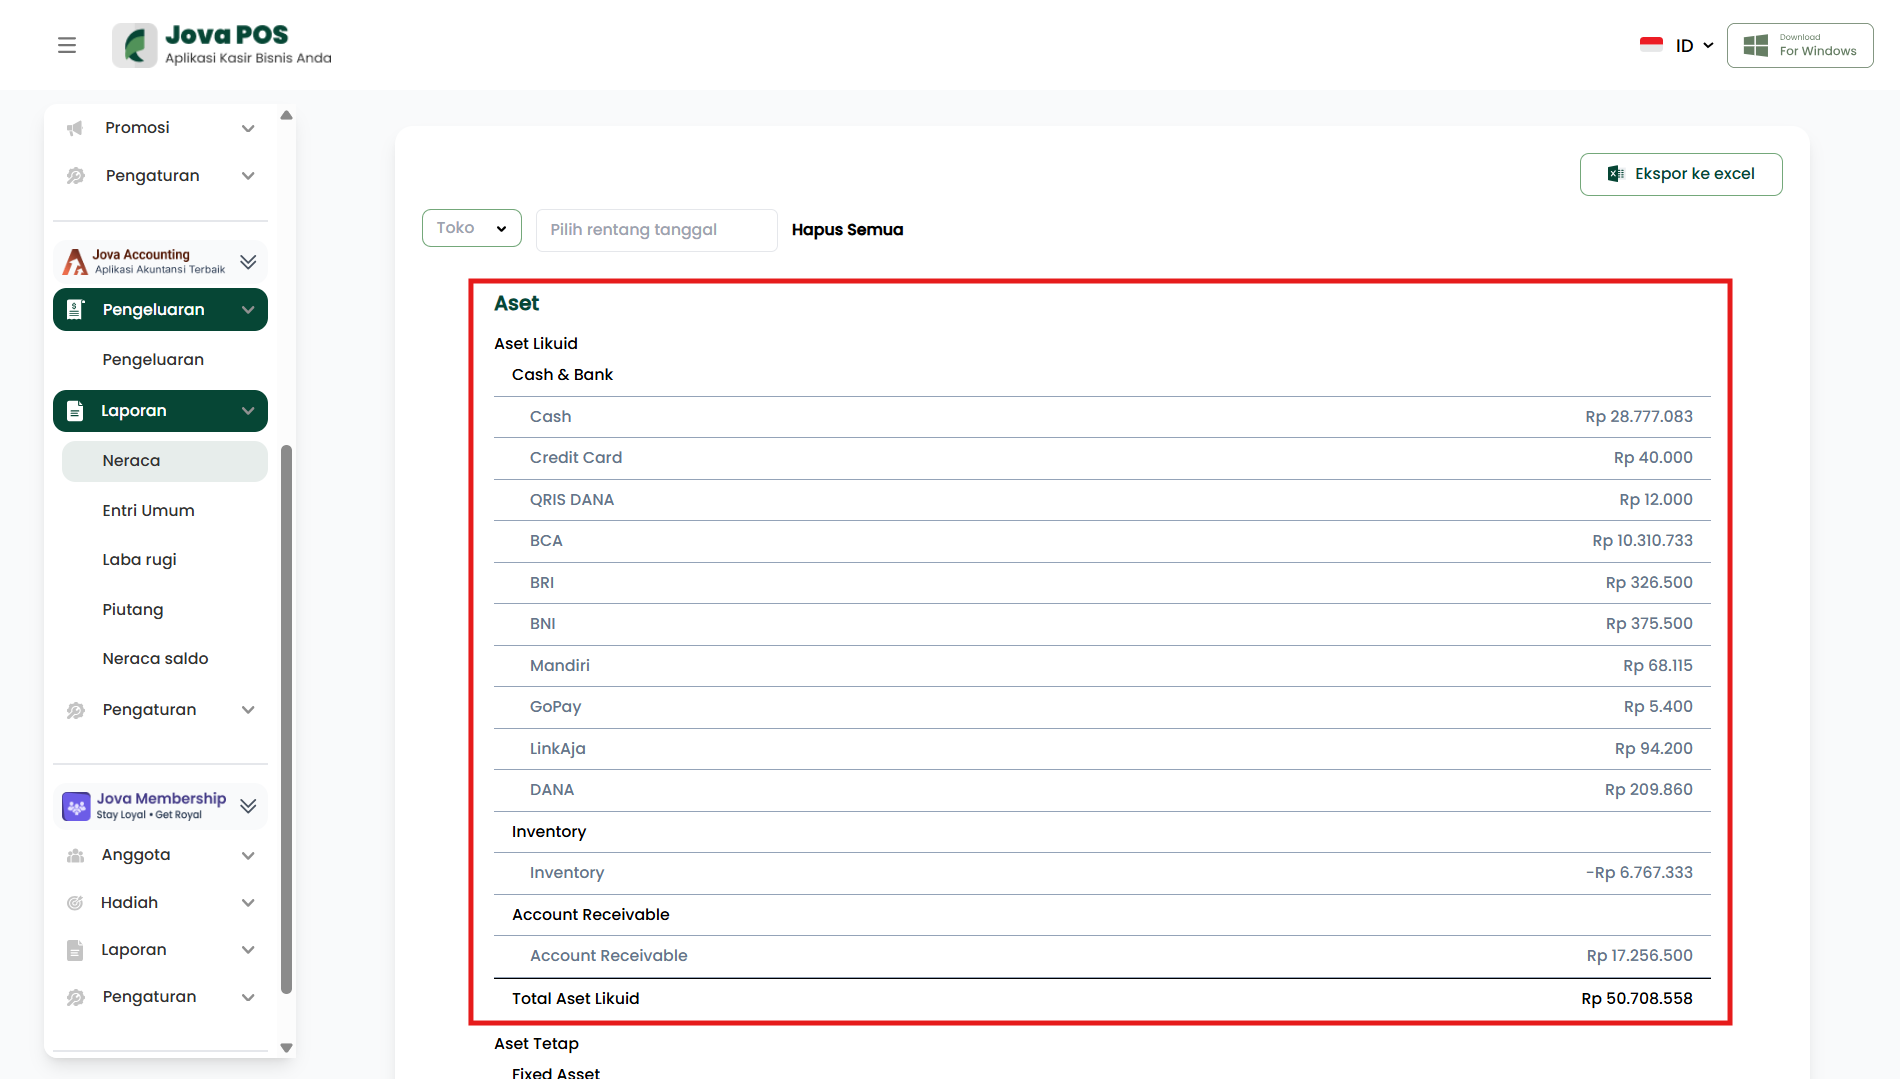
The Assets section shows the value of wealth owned by the store. Assets are grouped into two main categories: Current Assets and Fixed Assets.
Current Assets
- Cash and Bank: Contains accounts that are easily liquidated, such as cash and bank balances.
- Inventory: Displays the value of goods inventory owned by the store.
- Account Receivable: Displays the amount of receivables that customers must pay.
The end of the Current Assets section usually shows Total Current Assets, which is the sum of all accounts listed under it.
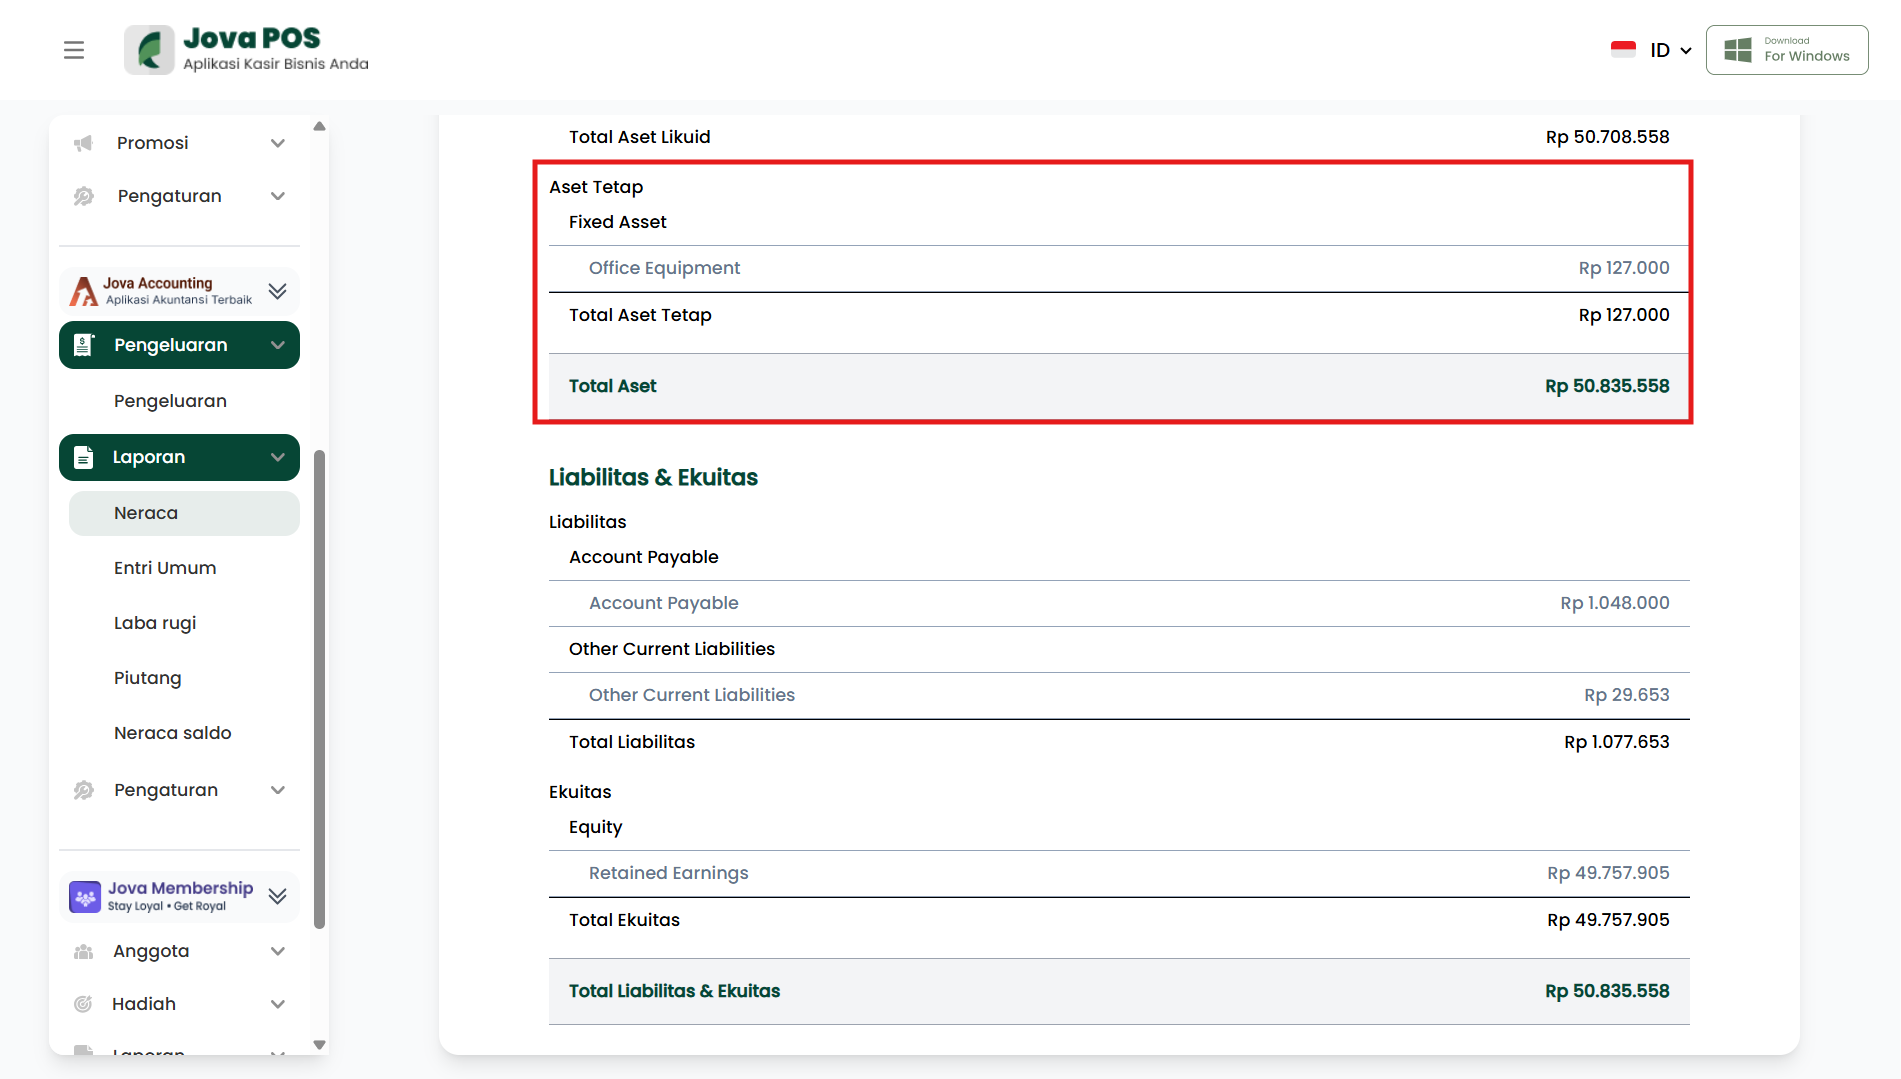
Fixed Assets and Total Assets
Below Current Assets, you will find the Fixed Assets section, which includes long-term assets such as office equipment or production machinery. Fixed assets are generally not easily liquidated but still have significant value for the business.
Examples of accounts in Fixed Assets:
- Fixed Asset: Category for assets that are not easily liquidated, e.g., office equipment.
- Total Assets: Displays the combined total of Total Current Assets and Total Fixed Assets.
3.2 Liabilities and Equity
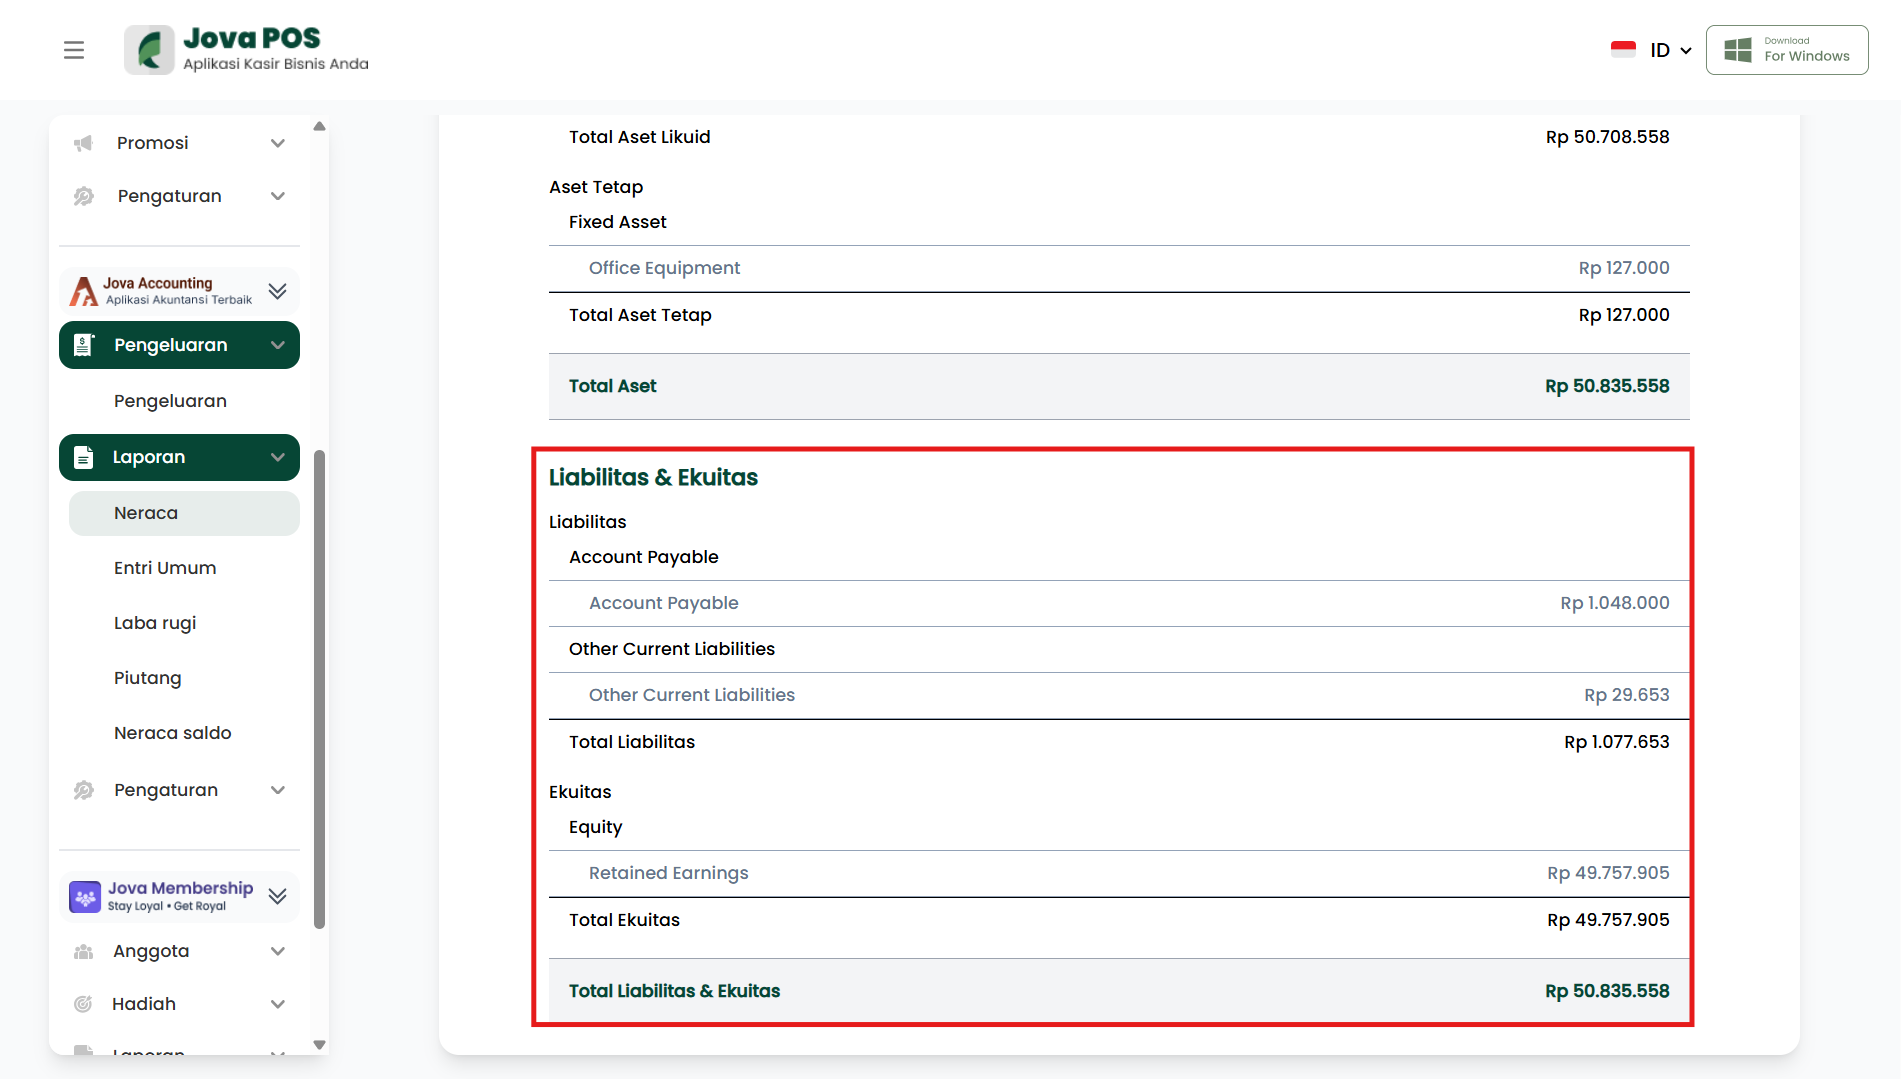
The Liabilities and Equity section records the store's obligations and capital.
Liabilities
Liabilities or obligations are all debts and obligations that must be paid by the company.
- Account Payable: Displays the amount of debt that the store must pay.
- Other Current Liabilities: Other obligations that need to be paid in the near future.
Usually, this section also includes Total Liabilities, which is the sum of all recorded obligations.
Equity
Equity shows the portion of assets derived from the owner's capital or investment.
- Equity: Capital owned by the owner.
- Retained Earnings: Profits that are retained and not distributed as dividends.
At the end of this section, Total Liabilities and Equity will appear, which should equal Total Assets if the report is balanced.
4. Exporting the report to Excel
If you need to save the report or process it further, use the export feature.
- Make sure the Store and date range filters are adjusted.
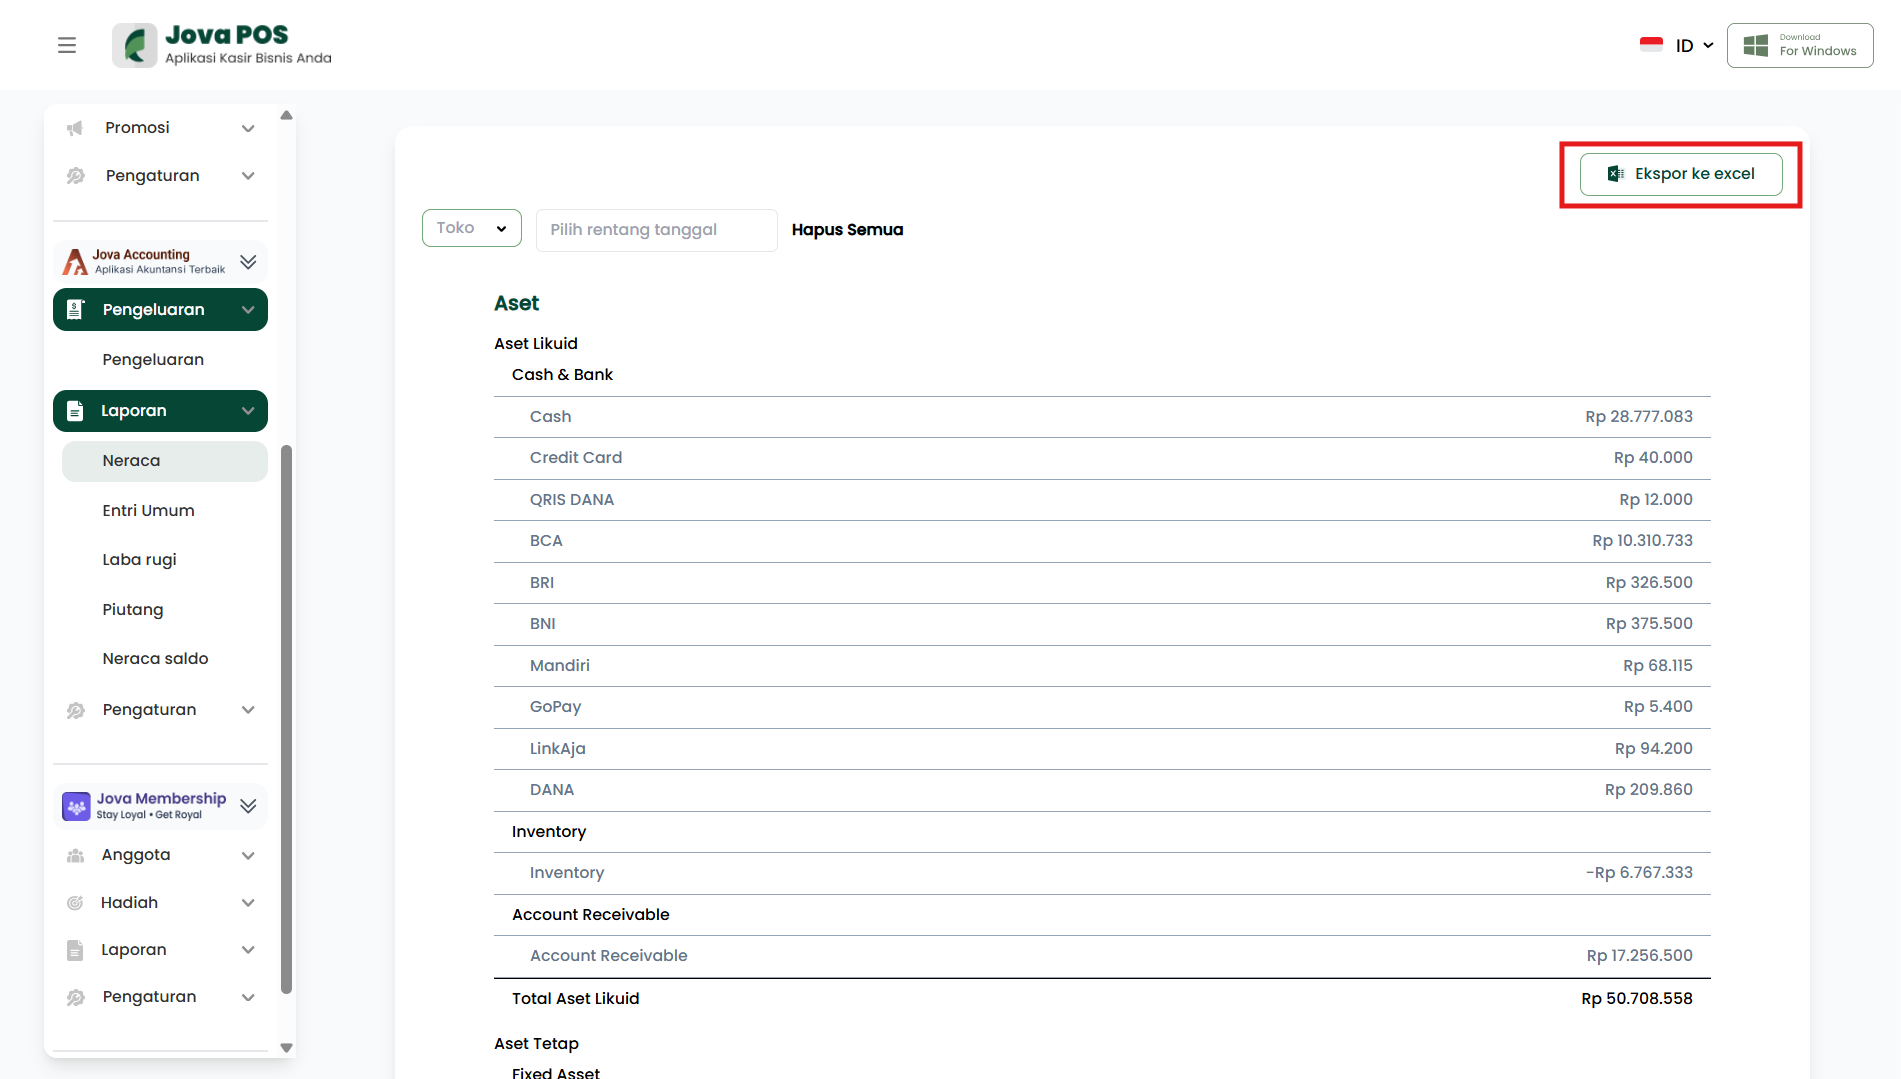
- Click the Export to excel button at the top right of the page.
- The system will download the report file in Excel format that you can open using a spreadsheet application like Microsoft Excel.